CIRCLY 7.0 – Alternative Graph Formats
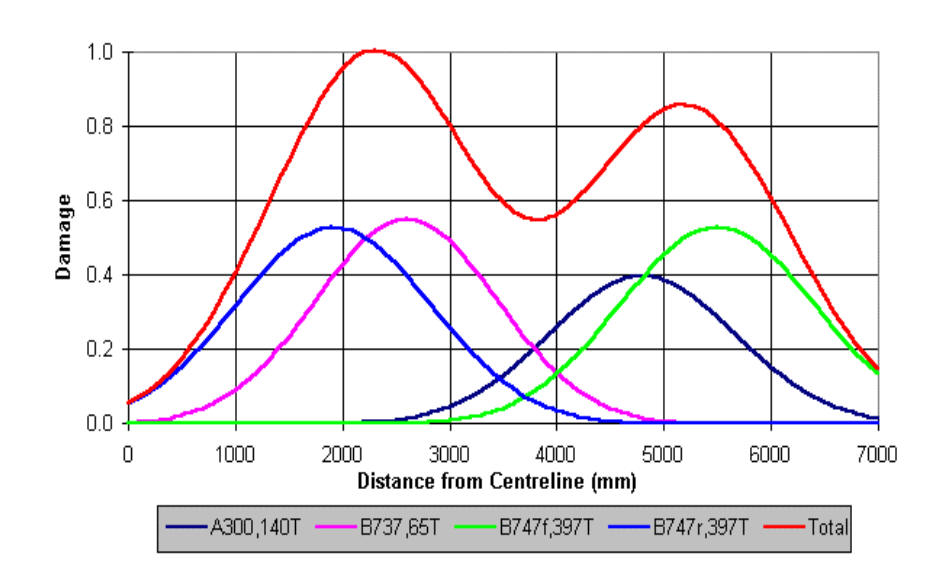
CIRCLY generates graphs that show the variation of the damage factor across the pavement.
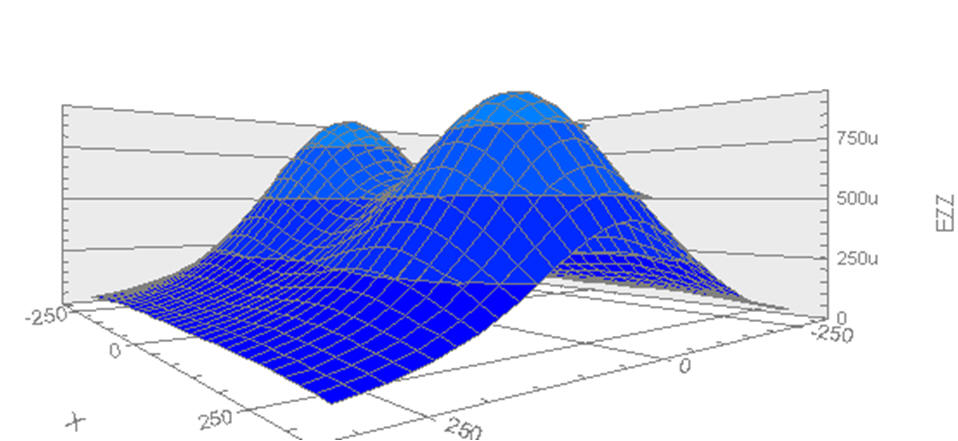
CIRCLY can also generate graphs of any component of displacement, strain or stress in two-dimensional or three-dimensional form.
Damage (CDF) plot
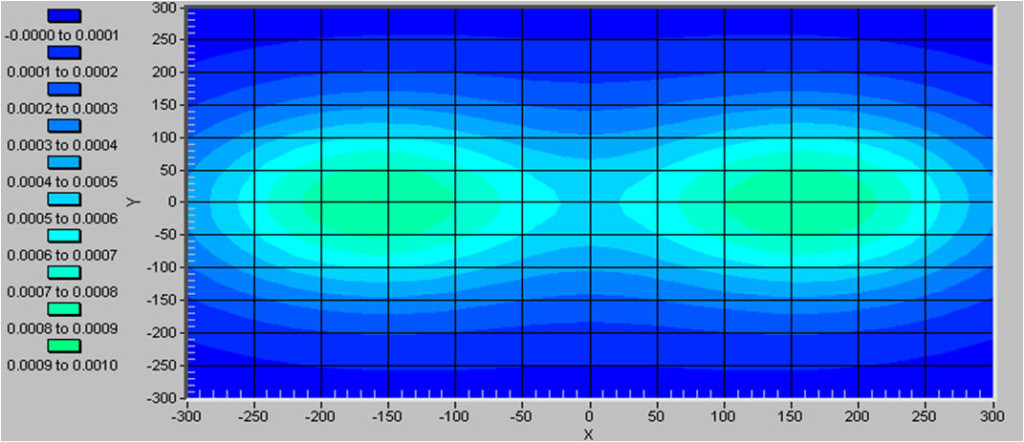
2D graph of any component of displacement, strain or stress
for example, surface displacements: 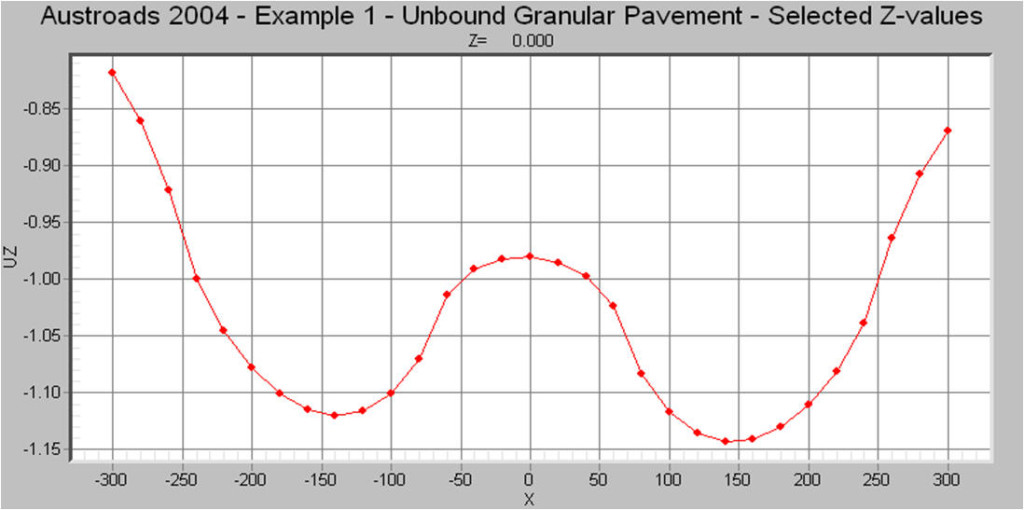
3D graph of any component of displacement, strain or stress
for example, strain pulse under dual wheels:
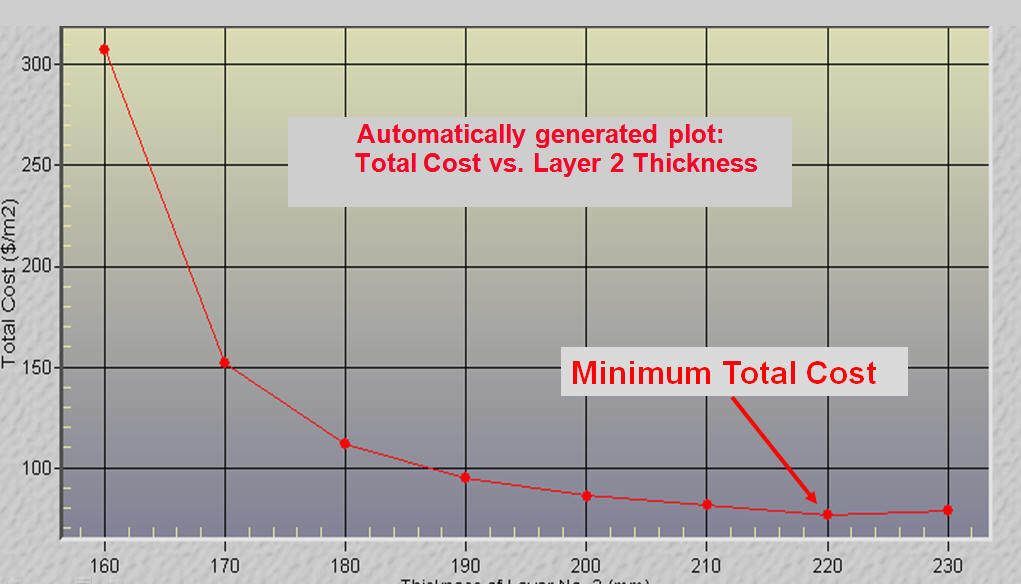
Cost Optimization graphs
Automatically generated plot: Total Cost vs. Layer 2 Thickness.