Innovative Airfield Pavement Design
Ooms Avenhorn Holding bv, Senior Manager Research & Development, Scharwoude, The Netherlands
SUMMARY:
Most of the economic activities around the world are located in delta areas along coasts. A common problem for these areas is that they lack space, especially to expand or build airports. This implies that if there is space available, it should be used, irrespective of the quality of the existing soil. To enable design and construction of economic (cost-effective) airfield pavements which are free of maintenance for a long period of time, the use of three-dimensional finite element simulations is necessary. Ooms Avenhorn Holding has utilized this approach for an alternative design for the Amsterdam Airport Schiphol 5th runway project. The result was a ‘balanced’ semi-rigid pavement design consisting of polymer modified asphalt layers on precracked cement treated base layers, in which the life of the asphalt on top and in between the (planned!) base cracks was ‘matched’.
Keywords: airfield pavements, design, maintenance-free, reflective cracking, settlements.
1. INTRODUCTION
Ooms Avenhorn Holding was invited by Amsterdam Airport Schiphol to develop an innovative alternative airfield pavement design concept for its new 5th runway. This new runway is urgently needed for this Airport, which is one of the European hubs, because of the limited capacity of the existing four runways, due to noise and wind restrictions. Given its economic importance, it is clear that this new runway should be free of maintenance for a long period of time. This objective is a hard one, especially because Schiphol is located in the western part of the Netherlands, where the soil consists of layers of peat and clay up to a depth of 20 m below ground level. More specifically, Schiphol is located roughly 5 m below sea level at the bottom of a former lake; the lake was impoldered in the 19th century and used for agriculture until in the 1920’s the development of Schiphol started. Typical soil conditions in the Schiphol area are about 7 m of peat/clay on top of so-called Pleistocene (quite stiff) sand layers. Interesting to note is that in the 1950’s, when jet airplanes were introduced in commercial aviation, Schiphol constructed so-called sandwich type pavement structures, consisting from top to bottom of: asphalt, unbound granular material and concrete [1]. All in all, from the foregoing it has become clear that the Ooms company was faced with a tough design challenge, considering the expected widespread use of triple gear new large aircraft in future and the strict demands on the runway profile (uneven settlements!).
In this paper an overview is given of the innovative aspects of the Schiphol 5th runway design made by Ooms Avenhorn Holding. It will also become clear how finite element analyses were utilized to verify the proposed alternative when it will be subjected to effects of aircraft traffic, temperature variations and (uneven) settlements. All these types of loadings will or can be activated during the required 40 years design period; temperature variations also in the phase of construction.
2. DESCRIPTION OF RUNWAY CROSS-SECTION
A sketch of the proposed cross-section of the runway is shown in figure 1. The selected type of structure (semi-rigid) combines in an economic (cost-effective) way the advantage of a flexible structure (no cracking due to settlements) with the advantage of a stiff structure (distributing aircraft loadings to a large subsoil area). The thin asphaltic mixture between both cement treated base layers guarantees a frictional interface between these layers for a long period of time; temperature variations (shrinkage/expansion) and uneven settlements cannot ‘separate’ these layers. The latter would of course be detrimental for the required flexural stiffness of the entire pavement structure.
Figure 1 Sketch of Proposed Runway Cross-Section
Use was made of the sand, already needed to shorten the consolidation process in the underlying soil, to prepare the lower part of the cement treated base. This base layer was chosen as thick as possible with the current stabilization equipment, in order to maximize the ratio between the obtained flexural stiffness and the investment. The top part of the cement treated base consisted of a plant made mixture of recycled masonry and asphalt. In both cement treated layers a cement percentage of 10 (by weight) was planned.
The bituminous part of the entire runway structure (the upper 200 mm) is from bottom to top composed of a 30 mm thick special type of asphalt mixture (Thermifalt: composed with 8 % Sealoflex® SFB5-90 bitumen), a reinforcing system, three each 50 mm thick layers of ‘standard’ polymer modified asphalt with jet fuel resistant Sealoflex® bitumen and high-quality aggregates (Grauwacke); the wearing course is a specially developed 20 mm thick jet fuel resistant layer called Novachip Durable Antiskid Pavement Layer (DAPL).
The precracking pattern (4 by 4 m slabs) in both cement treated layers and the way in which the reinforcing system is placed on top of the Thermifalt, are presented in figure 2. The reason to go for the diagonal type of precracking pattern, which makes an angle of 45° with the runway axis, is that compared to the traditional rectangular pattern (value of 0°), the traffic and temperature induced displacements are then ‘separated’.
Figure 2 Overview of Precracking and Reinforcement Pattern
The reinforcing system is composed by means of the product GlasGrid 8512 which has a stiffness of 8000 N/mm; as a glue with the surrounding asphalt, 1.2 kg/m2 of jet fuel resistant Sealoflex® polymer modified bitumen was proposed. The system is placed only at the 30 m wide central (trafficked) zone of the runway. The reinforcing product is of course layed down only on top of the cracks in the cement treated base layers; this in a width of 1.5 m. Laboratory pullout tests have shown that this anchorage length is adequate.
In order to reduce maintenance because of Foreign Object Damage (FOD) as much as possible, in the touch-down zone, the top and middle asphalt layer would be glued via spraying an amount of 1.0 kg/m2 of Sealoflex® jet fuel resistant polymer modified bitumen. The interface between these layers is at a depth of 70 mm below the surface. Laboratory interface shear testing (displacement rate of 5 mm/s) at several temperatures (ranging between -10 and +40 °C) showed that compared to a standard tack coat with 0.3 kg/m2 of plain emulsion, a higher shear strength and toughness could be obtained, for similar shear stiffnesses; the polymer interface also gave less variability in strength and toughness.
3. TRAFFIC LOADS
3.1 Base, subbase and subgrade layers
Use was made of the Australian airfield pavement design program called APSDS [3], in order to estimate the damage caused by the mix of aircraft traffic during the whole 40 year service period. Amsterdam Airport Schiphol had specified that during this period amongst small to medium ones, about 4 million heavy wheel loads (between 25 and 30 tonnes) belonging to the aircraft types B747-400, B777, MD11 and NLA (new large aircraft such as the A380) would pass. Despite the fact that in this so-called multi-layer program, the entire pavement structure is modelled as having infinite layers (in the horizontal direction), whereas in reality the cement treated base layers are precracked, it was still applied since by utilizing this quick approach, the most critical parts of the entire pavement structure (the cement treated base layers) are checked on the safe side; in reality the bending (flexural deformation) of these layers will be less since the 4 by 4 m slabs will deflect individually (move downwards). A nice aspect of APSDS is that the overall influence of the entire mix of aircraft, as specified by Amsterdam Airport Schiphol, and the effect of the degree of lateral wander is fully taken into account, thereby saving engineering time and increasing accuracy.
It is clear that for all materials (layers), stiffness moduli and damage laws had to be inputted in APSDS. These damage laws are of the type: N = (ef /e)r, where N represents the number of traffic load repetitions required to crack the asphalt surfacing, respectively the cement treated base layers or deform the sand subbase, respectively the peat/clay subsoil. The asphalt values for ef and r were based on Schiphol experience, the base layer values for these parameters were obtained from Ooms initiated laboratory testing and the sand/soil values for ef and r came from FAA-literature.
For the thin asphaltic layer located in between the cement treated base layers (the interface-asphalt mixture), the parameter ef was obtained from a Mohr-Coulomb law established for this purpose (see figure 3). The parameter r for this material could be obtained from cyclic tensile tests and by extrapolating cyclic aggregate interlock tests [2]. To be able to analyse the shear induced fatigue of the interface-asphalt layer in APSDS, a shear damage law was especially created for the Ooms alternative by Wardle [3].
In a later stage of the design process, also tensile stress (st) based damage laws for the cement treated base layers were incorporated. These were log N = 8.865 – 3.166 * st for the stabilized mixture of aggregates and log N = 12.0 – 12.0 * st for the stabilized sand.
Figure 3 Obtained Mohr-Coulomb Relationship for Interface-Asphalt
Examples of computed distributions of the Cumulative Damage Factors along the width of the runway after 30 years of aircraft traffic, are given in figures 4 and 5; this for the upper cement treated base layer as well as for the interface-asphalt layer (note that a CDF-value of 1 implies failure of a specific pavement layer!). It can be observed that damage is concentrated at roughly 5 m from the centerline. It is noted that the whole front gear or the whole rear gear of all planes were taken into account (so for each case both the wheels at the left and right of the centerline), see figure 2.

Figure 4 Computed CDF-Distribution of Upper Cement Treated Base Layer
Figure 5 Computed CDF-Distribution of Interface-Asphalt Layer
It is recalled that use would be made of the already present sand, to prepare in-situ the lower cement treated base layer. The well-known drawback of an in-situ approach is that quite a lot of variability in mechanical properties can be expected to be found. To quantify this aspect, the Ooms company carried out a small study. In total 16 cores were taken from an industrial site, which was build-up with sand placed by wet transport (pipelines) and stabilized in-situ with modern equipment to a depth of 500 mm. Before testing, the cored cylinders were divided in three (top/middle/bottom). By performing acoustic stiffness and subsequent compressive strength testing in the laboratory, it was found that variability along the site was much more predominant than in depth (top/middle/bottom of each cylinder). This implies that the cement mixing process and the compaction quality with depth are no issues with respect to variability. Important with respect to this are: the grading curve of the sand and the differences in compaction (number of roller passes) along the site. With respect to the latter it can be mentioned that modern rollers with compaction monitoring equipment can be very useful. Interesting to note is that the following relationship was found between the acoustic stiffness and the compressive strength values: Eacoustic = 4300 * sc0.65 (units MPa), as measured after a period of 28 days after construction. Given the nature of this relationship, it is clear that the acoustic stiffness showed less variability than the compressive strength (the coefficients of variation were roughly 25 %, respectively 35 %).
Based on the foregoing it was felt that enough understanding was generated to come up with a minimum base material stiffness to be utilized for the Schiphol 5th runway design process (in the latter situation, sand was planned to be transported by trucks, which causes less variability due to the phenomenon of segregation; furthermore, a higher cement percentage would be used). The value for the design stiffness was also based on the experience that investigations on laboratory prepared specimens had revealed that the so-called dynamic stiffness as obtained by means of mechanical servo-hydraulic testing (the parameter to be used for the design process!) was roughly half the acoustic one. The latter finding has interesting practical implications since an acoustic test can be done easily in the field on cored cylinders.
All in all, it could be concluded that it will take at least 30 years to crack the base layers due to traffic induced fatigue. It can be estimated that before this type of cracking will become visible at the asphalt surface via the well-known alligator skin shapes, certainly another period of 10 year passes [4]. This also because at several levels (heights) in the pavement, extra resistance to upward propagation of the base fatigue cracks is build-in (the porous interface-asphalt, the Thermifalt and the reinforcing system).
3.2 Asphalt
During each passage of an aircraft, stress concentrations will be generated in the bituminous surfacing just on top of the cracks (notches) in the cement treated base layers. These will cause the reflection of the precracking pattern into and through the surface of the wearing course. This phenomenon of reflective cracking has been generating lots of discussions and debates in the past. As described in detail by de Bondt [2], the only way in which this special type of cracking can be investigated, is via the finite element method. A short overview of the work done for the Schiphol 5th runway project on this, is described below.
The mesh prepared for the CAPA-3D traffic loading analyses, is presented in figure 6; the program CAPA-3D is the PC-based version of the finite elements program INSAP which is under development at the section Structural Mechanics of the Department of Civil Engineering of Delft University of Technology [5]. The ‘traffic’ mesh consisted of 5265 elements and represents a part of the runway having four by three cement treated slabs (this is 16 m in the longitudinal direction by 12 m in the transverse direction). Because of symmetry only half of this part of the runway had to be inputted. The mesh itself is thus 16 by 6 m. The peat/clay layers had a thickness of 7 m. Since at this depth the relatively stiff Pleistocene sand layers are located, the nodes at the bottom of the mesh were fixed in all directions. The vertical edges were not restrained. Potential load transfer in the cracks was not taken into account, since it has been found that in the long run this hardly exists anymore [2]. The stiffness (Young’s modulus) of the asphalt layers was set equal to 2500 MPa; the shear stiffness of the interface between the asphalt and the base to 0.5 (N/mm)/mm2. Based on laboratory testing, the Young’s modulus of the cement treated aggregates (upper base layer) was set equal to 8500 MPa; a value of 4500 MPa was used for the cement stabilized sand layer. The stiffness of the interface-asphalt was 2000 MPa. Values for the sand subbase and the (existing) soil were 100 MPa, respectively 30 MPa.
Figure 6 Mesh used for the Simulation of Aircraft Loadings
The effect of two positions of a single wheel load were examined; one when the vertical load (magnitude 30 tonnes, distributed on an area which is 600 mm long and 400 mm wide) is just next to the base crack (notch), as denoted by P, and one when the load is placed centered with respect to the base crack (denoted by Q). Unfortunately, not enough time was available to examine if other load positions would perhaps be worse. Given the large distances between aircraft wheels, as compared to the total asphalt thickness, only a single wheel was taken into account. Wheel load interaction was in this case thought to be of minor importance.
From computed profiles of vertical displacements along the pavement surface, it became clear that the off-centered load position caused the largest degree of flexure. Important to mention is that only in the top part of the base crack, compressive actions along the crack occur. This implies that the use of a material (in this case cement stabilized sand) in the lower base layer, which does not have the potential for aggregate interlock (only for dry friction along the crack faces), is not a disadvantage.
Computed tensile strains in the bituminous surfacing are given in figure 7. It can be observed that the effect of the discontinuity (notch), the presence of large tensile strains, is limited to the bottom part of the asphalt. This is the reason that the (relatively expensive) Thermifalt mixture was planned only at this location.
Figure 7 Computed Principal Strains along Asphalt Cross-Section
Although the incorporation of the flexible and tough Thermifalt increases the lifetime of the bituminous surfacing, it can be deduced that it will be less than the required 4 million heavy wheel load passages [4]. In other words, it is inadequate. In order to solve this problem, a reinforcing system was thought to be used on top of the Thermifalt. Its effectiveness has been assessed as follows: from the computed displacements at the level (height) of the top of the base cracks (= bottom of asphalt layers), it can be derived that during a wheel passage a relative vertical movement at the edges of the crack of about 0.1 mm occurs. By using this slip value, it can be deduced, based on numerical crack propagation studies carried out in the past by de Bondt [2], that a properly anchored reinforcing product with a stiffness (EA)rf equal to 8000 N/mm, can increase the lifetime of the remaining (uncracked) 170 mm thick bituminous surfacing by a factor of roughly two. To achieve this durable anchoring, a polymer modified tack coat (with Sealoflex® bitumen) was planned to be sprayed.
All in all, it can be expected that after a 40 year service period the runway would show only at a very few locations, traffic induced reflective cracking above the base cracks.
4. TEMPERATURE VARIATIONS
It is a well-known fact that cementituous materials show shrinkage cracking. For instance in the situation of a Dutch road pavement, a cement content of 10 % by weight, implied that after 1 month, average transverse crack spacings of about 6 m could be observed in a non-covered (fully exposed to weather conditions) stabilized layer of sand [2]. It is obvious that depending on the climatic conditions (severity of the winters) and the thickness of the bituminous surfacing (degree of insulation), after a certain number of years, a reprint of the full base crack pattern will eventually become visible in the asphalt wearing course.
The phenomenon described above has led to the development of precracking techniques. A common practice at Schiphol is to ‘produce’ rectangular shaped base slabs of 3.5 by 3.5 m. Based on asphalt mix testing results, temperature drop assessments and numerical crack propagation studies [6], old Dutch semi-rigid pavement field experience from the 1970’s and 1980’s could be extrapolated. This supported the Ooms decision to go for a precracking distance of 4 m, which saves costs (with respect to the 3.5 m option).
To verify the influence of temperature variations in time, also for this type of loading, 3D-finite element analyses were carried out. Figure 8 gives (exaggerated) deformations of a part of the mesh which was prepared. The mesh, size 4 by 4 m, consisted in total of 7174 elements and was first of all subjected to a uniform drop in temperature equal to -40 °C, representing a seasonal cycle. Because of symmetry only a central location, where four slabs come together, had to be analyzed. The vertical edges of the mesh were fixed in the x-direction for the x-planes and in the z-direction for the z-planes. The bottom of the mesh, at a depth equal to 3 m below the stabilized sand, was fixed in all directions. The stiffness of the asphaltic layers was set equal to 1000 MPa. A shear stiffness value of 2 (N/mm)/mm2 was given to the asphalt/base interface. The coefficient of thermal contraction of the asphalt mixtures was set to 2.8*10-5 -/°C; the one of the cement treated base layers to 1.0*10-5 -/°C.
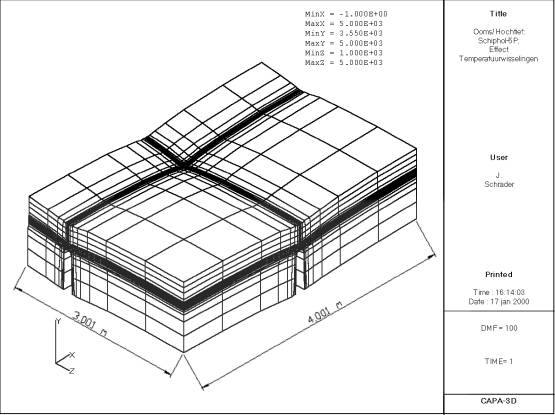
Figure 8 (Exaggerated) Deformations due to Seasonal Temperature Variation
The computed distribution of the tensile strains along the cross-section of the asphalt just on top of the junction of the base cracks (notches) is given in figure 9; this for precracking distances of 3.5 m, respectively 4 m. First of all, it is clear that the seasonal cycle primarily causes large strains at the bottom of the asphalt layers; the distributions are certainly not uniform in depth. Furthermore, it can be deduced that the maximum strain increases by a factor of 1.10 due to the increased precracking distance, which is smaller than could be expected by simply dividing the individual slab dimensions (4.0 / 3.5 1.14). Interesting to note is that an approximative analytical approach via a two-beam model [2], would have resulted in an ‘average’ tensile strain value of 0.333 % for the 3.5 m case and 0.365 % for the 4 m case. All in all, it is clear that the asphalt strain values are within acceptable limits [7], especially because of the application of the Thermifalt mixture.
Figure 9 Computed Asphalt Strains Caused by Summer/Winter Movements
It is clear that not only summer/winter but also day/night cycles occur. Figure 10 illustrates the simulated exponentially shaped daily temperature variation; this one could be obtained from literature [8]. In this case the stiffness of the bituminous layers was set to 2500 MPa; the shear stiffness of the asphalt/base interface to 2 (N/mm)/mm2.
Figure 10 Simulated Amplitude of Daily Temperature Change
The stresses in the bituminous surfacing are presented in figure 11; this for the final phase as well as for the construction phase of the runway. It is visible that in both phases the largest stresses are generated at the surface. It can also be seen that during construction, due to the limited degree of insulation, a considerably larger degree of tension can be developed (of course only in case of bad luck with weather conditions); this especially at the bottom of the bituminous surfacing where later on, aircraft loading effects are also concentrated (see figure 7)! It is obvious that this was one of the reasons to introduce the tough (crack resistant) Thermifalt mixture.
Figure 11 Computed Stresses in Asphalt due to Daily Temperature Variations
All in all, it can be concluded that thermal induced reflection of cracks is within a 40 year period very unlikely to happen.
5. UNEVEN SETTLEMENTS
In order to be sure that the thin asphalt layer between the upper and lower cement treated base layer (the interface-asphalt) does not fail due to uneven settlements, extra finite element analyses were performed. A part of the runway with the size of four by three slabs was simulated; the mesh was 16 by 12 m and composed of 8568 elements. The stiffness modulus of the interface-asphalt mixture was equal to 150 MPa. Figure 12 shows the (exaggerated) deformations of the pavement (asphalt + base layers) in the situation of soil actions. The uneven settlements have been simulated by means of applying prescribed displacements onto the bottom of the mesh (see figure 13). Because of the proposed special consolidation treatment of the peat/clay subsoil, settlements can be expected to be limited to the values shown in this picture. Figure 14 shows the computed shear slip between the top and bottom part of the interface-asphalt. By keeping in mind that the settlement occurs in a period of time of several months (which causes a low shear modulus, as can be obtained from a so-called ‘mastercurve’) and utilizing the Mohr-Coulomb relationship given in figure 3, it can be deduced that the quality of the asphalt mixture which was developed, was high enough. Important is that the asphalt thickness is exactly 20 mm. The latter was proposed to be achieved by precise milling (levelling) before and after placement.
Figure 12 (Exaggerated) Pavement Deformations in case of Uneven Settlements
Figure 13 Prescribed Permanent Deformation of Subgrade
Figure 14 Computed Shear Slip in Interface-Asphalt Layer
From the foregoing it has become clear that even in case of (limited!) uneven settlements, no damage is introduced in the proposed pavement structure due to the loss of shear resistance between the upper and the lower cement treated base layer. This is due to the presence of the thin interface-asphalt layer. The analyses have shown that this layer itself is flexible and tough enough for this purpose. Loss of shear resistance at the transition between the interface-asphalt layer and both base layers is to be prevented by using an open type of mixture (20 to 25 % voids) and roughening both the stabilized sand and the interface-asphalt before it is covered with a new layer.
6. CONCLUSIONS AND RECOMMENDATIONS
It can be concluded that for the Amsterdam Airport Schiphol new 5th runway case, an approach consisting of introducing existing and new top quality materials, in combination with 3D-finite element analyses on the mechanisms (traffic, temperature cycles and uneven settlements) which can be active, has resulted into a cost-effective airfield pavement design concept, which is interesting for runways of busy airports, where during a long period of time maintenance should be avoided; especially in soft soil areas. In this way it becomes possible to optimize (‘balance’) semi-rigid pavement structures. In the past these types of pavements, which consist of several asphalt layers on top of cement treated base layers (weight percentage cement more than 8 %) were often rejected, because the lifetime of the asphalt at and in between the base cracks could not be ‘matched’. With the current stabilization equipment and monitoring tools, in-situ stabilization can provide an economic (cost-effective) and reliable base for heavily loaded pavements (not only at airfields, but also at industrial facilities). This is especially true in delta areas along coasts, where sand and gravel can be quarried in a cheap way or are often already available on site.
By using the current state-of-the-art personal computers and finite element software, it is in case of big pavement construction projects very well possible to use numerical analyses during the design stage; this for several types of loading (traffic, temperature variations and uneven settlements). The fact that mesh preparation is time consuming is not a real problem, given the importance of the output. The only things which are missing at the moment are: a) easy, semi-automatic placement of (multiple) wheel loads and corresponding maximum stress/strain search algorithms and b) fast and reliable iterative solvers. With respect to a), it can be mentioned that this is needed because it is a priori unknown what the critical loading is. Especially in case of triple gear aircraft this can be a serious issue, because the optimum precracking pattern of the cement treated base layers depends on this. The automatic way of applying (multiple) loadings is required, because there are certainly not enough skilled pavement designers available on the market to do this job, and depending on researchers is not a solution. With respect to b), it is clear that parametric design cases are extremely time consuming.
REFERENCES
1. Clerx J.W., Construction and Design of Runways, Taxiways and Aprons. Dutch Road Congress (in Dutch), 1957.
2. de Bondt, A.H., Anti-Reflective Cracking Design of (Reinforced) Asphaltic Overlays, Ph.D – Thesis, Delft University of Technology, 1999.
3. Wardle, L., APSDS – APSDS – AIRPORT PAVEMENT DESIGN SYSTEM, 1999.
4. de Bondt, A.H., Moßig, H. and Schrader, J.G.F., Alternative Pavement Design Study for Amsterdam Airport Schiphol 5th Runway Project (in Dutch), 2000.
5. Scarpas, A. and Kasbergen, C., CAPA-3D User’s Manual, 1999.
6. de Bondt, A.H., Effect of Reinforcement Properties. 4th RILEM Conference on Reflective Cracking, Ottawa, 2000.
7. de Bondt, A.H., Special Applications of Sealoflex Polymer Modified Bitumen, Sealoflex World Conference Japan, 1999.
8. Jayawickrama, P.W., Smith, R.E., Lytton, R.L. and Tirado, M.R., Development of Asphalt Concrete Overlay Design Equations, Texas Transportation Institute, USA, 1987.